You may have heard of digital twins before, but have you ever thought about how complex this can be to build? This is a retelling of a recently completed assignment for one of our clients, a so-called Proof-of-Concept test (hereinafter abbreviated ‘PoC’) of a digital twin as a visual source of information. The assignment was performed on behalf of and together with The Norwegian Mapping Authority. We have received their approval to share this blogpost.

The Norwegian Mapping Authority is an institution with roots dating back to the 18th century. They take care of several societal responsibilites, central to this is the mapping, coordination and making available of localized information. A key service they offer (on behalf of a number of partners) is Geonorge. This is a portal that gives access to both maps and open data about examples such as subject matters from land areas and according properties from bottom sediment in the sea to the soil ashore. The Norwegian Mapping Authority wants to improve their offerings, and in this context digital twins are considered a relevant part of a not-too-distant target state.
Why digital twins?
The objectives of any adopters will vary. But one can generalize and say that digital twins exist largely to provide users with information, the most important prerequisite for making qualified decisions. Primarily in the form of overviews, possibly also as deeper insight. By far the most important characteristic of digital twins is (given that they are well built) that they provide an opportunity to shed light on the interrelations across different conditions, presented in a visual, easy-to-understand manner, close to reality. If, for example, one was to consider buying a property and raise a building upon it, looking at the property in a local authority (municipal) context could reveal possible influential conditions, such as connections to water supplies and sewer, electrical and possibly fiber optic infrastructure, additional regulatory plans, etc. And if you then want to build a house on the plot, you can check the views and sun conditions – in different directions, from different floor levels – all before you decide. And if/when many players utilize the same digital twin (implied: enter their own data into it), everyone can run what-if analyzes on a range of conditions – all of which may have a data basis.
When we were given the assignment, we noticed the primary purpose: to test out the Terria software so that most people can access a well-functioning digital twin, like Australia has actually been offering their population over the last couple of years (here you will find a three minute video about NSW Spatial Digital Twin. It is well worth watching). Later in our assignment, we became more aware of a wording in the request which was that the customer wanted a team with two junior developers (full-time) and a project manager (part-time). Initially, we did not fully understand the rationale behind this, and only assumed that it had to be to save costs. But gradually it became clear to us that the purpose was to find out how easy/difficult it is to work with GIS (Geographic Information Systems) and geodata when entering the field from the outside, i.e., without belonging to the ‘tribe’ of professionals who deal with these matters daily. The Norwegian Mapping Authority wanted to gain better insight into the barriers and challenges an unexperienced group of developers may encounter when they want to implement a digital twin using data and services from Geonorge. let’s state this right away: The learning curve proved to be steep, but overcomable – and besides exciting and rewarding!
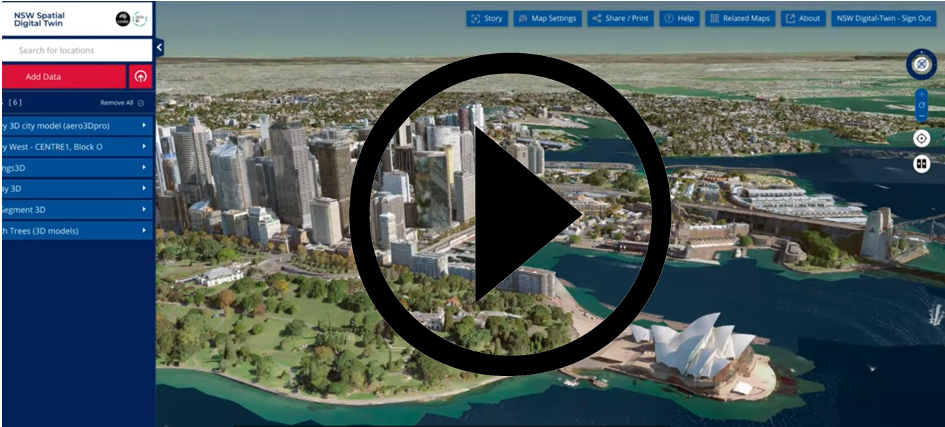 Above we see the New South Wales demonstrator (see above section) who in many ways started the author's journey of admiration and wonder - a journey that is still ongoing.
Arrangement and Participants
Under the management of R&D director Reidun Kittelsrud, our client had put together a separate task force team, broadly represented from various disciplines. In addition, Knowit’s delivery team (two newly hired developers and the undersigned), the remaining Mapping Organization (the ‘line’) and representatives from the Australian research organization CSIRO Data61, i.e. the developers behind TerriaJS (more about this later in the blog post). We got an overview of what to do and got started. To keep the customer informed and possibly adjust courses along the way, weekly status meetings were held. In addition to this, we worked mostly on our own, only interrupted by focus meetings with people from the line.
What is a digital twin, really?
Although both ISO and others have come on the scene with reference architectures and other things, the answer is probably that ‘It depends on who you ask’. We like to claim that it is a kind of virtual shadow or representation of reality. How precise and/or up-to-date it is, those are matters that ‘depend’. It is not uncommon for companies to say that digital twins equal 3D models. However, models that are not twins often show stand-alone copies of a product (such as a car, furniture, or piece of clothing) or a given physical installation (such as a building and/or a road segment, often supplemented with such things as gardens, walkways and onramps/exits). The understanding of digital twin that is used in this blogpost is a geospatial depiction of “the entire” physical reality out there. The reason why “the entire” term is put in quotation marks is because we had to limit ourselves to elements that could fall within the outer boundaries of the country of Norway, and more specifically linked to two urban regions: Stavanger and Oslo.
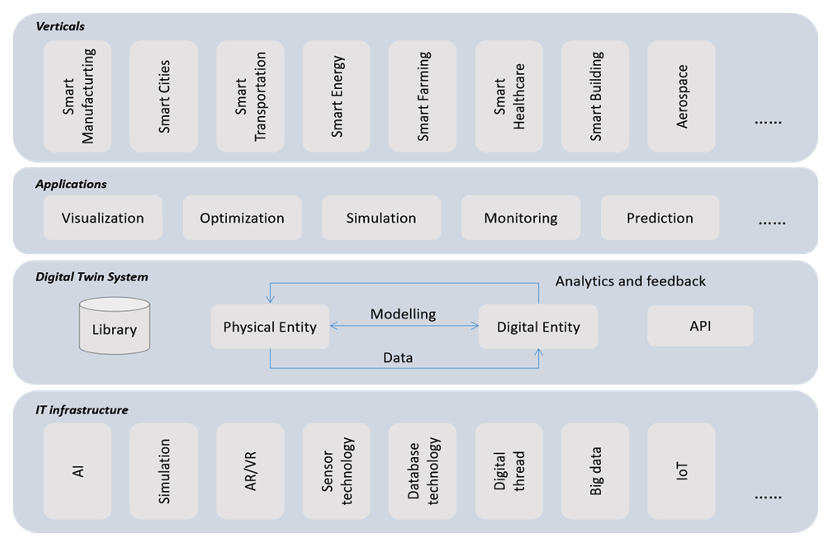
Above we see the ISO reference architecture for digital twins (a so-called PWI or Preliminary Work Item from JTC1 SC41 AG11, i.e., their Joint Technical Committee 1, Sub-Committee 41, Digital Twin Advisory Group 11). This is very generic but shows how ISO believes such a service should be realized, in the form of a separate layer that should be available across user categories and technical components.
Let's look at some more specific use cases:
Let’s look at some use cases: Within the architecture/engineering/construction (AEC) industry, using BIM – Building Information Model – as a common process to first design buildings virtually, and then realize them physically is becoming increasingly common. Within BIM, the most common today is so-called level 1 or 2, i.e., that you use CAD (Computer-Assisted Design) in 2D/3D, with or without so-called Common Data Environments (CDE). BIM models can be combined with measured conditional data (where changes over time represent the fourth dimension; 4D), but this occurs less frequently. While at BIM level 3, the goal is to provide complete integration of ‘all’ influential conditions. In other words, not limited to the time axis (4D), but preferably also costs (5D) and adjacent conditions such as ownership. We would argue that it is only if you ‘go all the way’ that you can hope to achieve a reasonably complete copy of reality; that is, an actual digital twin. Based on such reasoning, one can say that BIM level 3 implies digital twin, at least one kind of digital twin. For the record: BIM involves more than models, and the work processes shared among different contributors are by far the most important (but still fall outside what this article is intended to cover).
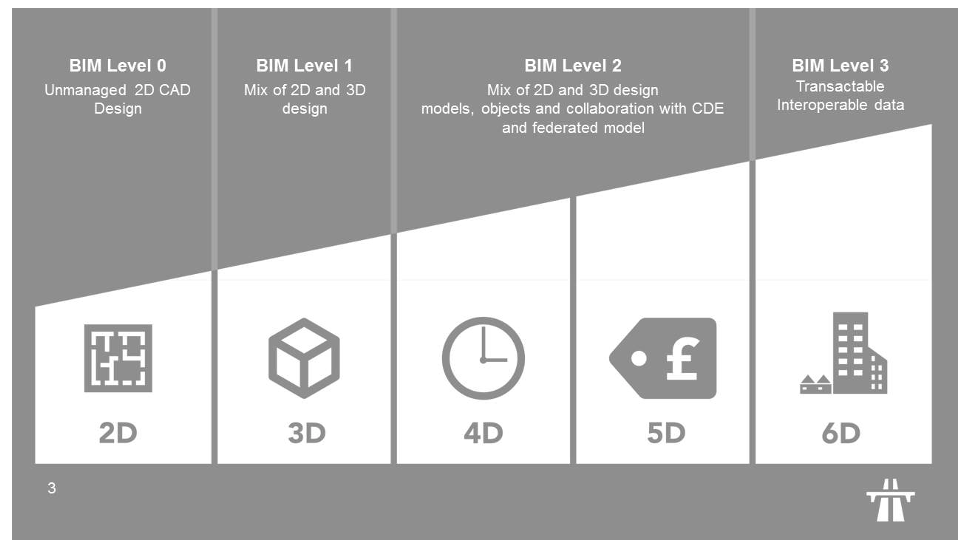 Above we see how the Civil Engineer blog explains the link between BIM levels and dimensions.
A distinguished separation lies between when digital twins are geospatial or not. The word [geospatial] means nothing more than that something has been given location coordinates in a global context. In some contexts, location is critically important: If one e.g. will build a tunnel and the excavation begins from both sides, then the importance of both bores matching each other will be decisive for whether all other work becomes a success or not. However, if using a mobile phone or GPS to read a position appears easy, the underlying calculations for determining the location (coordinate) of a given geo-position can be far more demanding. It is also not given that different types of data have the same prerequisites for coordinate determination. For the Norwegian Mapping Authority, it was a point by itself that the digital twin should not be considered a stand-alone thing, but rather be represented in correct geographical context – i.e. that all data must be coordinated and composed along with other data, so that the reproduction becomes a close match to reality.
The digital twin that the Mapping Authority asked us to test was of course not based on independent elements, but geospatial or location based. In addition, we were to combine 2D maps with 3D (terrain, incl. heights/depths, i.e. meters above/below sea level, as well as buildings and other man-made physical installations) and even so-called 4D (where time constitutes the 4th dimension), in the sense that it should be able to manage changes over time.
Examples of digital twins
As mentioned earlier in this blog post, the Australian digital twin shows how far one has come in the New South Wales region, in the south-eastern corner of the country. This is available via https://nsw.digitaltwin.terria.io/ (and runs on top of the same software as our PoC does).
In Finland, a different approach has been chosen, in which selected parts of Helsinki are shown with a photorealistic representation, i.e. so close to reality that it becomes difficult to discover that the digital twin is in fact only an imaginary model. This one is also publicly available via https://virtualhelsinki.fi/, and runs on commercial software from Bentley. That same technical platform underlies a larger model of Singapore. In many ways, the latter are more reminiscent of the Australian approach, but in Singapore they have chosen not to expose everything to the outside world. Another example is located nearer to us – but we do not know it very well – Virtual Gothenburg. One of the things we find exciting is their use of CityGML, a technology base with which we so far have no practical experience.
The Norwegian Institute for Bioeconomics (NBIO) has chosen to show a selection of national data sets, based on a combination of 2D maps and 3D terrain. This is available via Kilden. The solution runs on free software, CesiumJS and a custom-developed project from the Swiss authorities. Here we need to mention that both Australia and our PoC also use Cesium (more on this further down).
Data, Data and Data
Without content (data), virtually all IT solutions become worthless. The decisive factor will be how a solution relates to/manages to represent data. What is probably unique about digital twins is that even though all digitally registered data tell us about ‘something that is happening’, the common perception is that a lot of data is not relevant outside its primary defined area of use. Information about one specific used car or person is somehow not that interesting unless you are interested in just those. But in the case of geospatial digital twins, almost ALL data can suddenly become relevant, as long as they are related to a given physical area. So, if the above used car or person example has actually been traveling in a location that was covered by a digital twin, well, then suddenly the information about these will also become relevant. Exactly when were they positioned at <this-and-that> physical location? How often? Which direction did they enter from? Did other parties arrive before or after <car_X> or <person_Y>? And so on.
The result is frequently that even though digital twins may originally be similar to other systems (they would typically arise because someone had a certain focus/purpose), digital twins can easily be combined with almost anything. Some of those who have experienced this are the digital twin provider AugmentCity with the city of Bodø as their user. Even though both began with particular use cases, the appliances have steadily increased since they were launched.
The consequence is that the infrastructure under a digital twin should be able to congest large amounts of data without becoming saturated. If you are already designing for big data IoT (Internet-of-Things) appliances, you will not be surprised by this, but for others it is not unlikely that the initial system footprint may ‘tear at the seam’.
Data Sets and Sources
In addition to a number of data sets that formed the foundation (Norwegian maps, seabed base maps and nautical charts, SeHavnivå (inspect sea level), Høydedata, FKB-Bygning, Matrikkel Adresse (cadastral register), all of these from the Mapping Authority and Geonorge), we supplemented with information on such as ‘Europe simplified’ and European basic maps, as well as time series from Statistics Norway, weather data from Yr, buildings from Open Street Map (OSM) and the EU’s INSPIRE, BIM models for selected buildings (such as the Opera), and traffic data from the Norwegian Public Roads Administration (Veivesenet) and EnTur.
Without enriching the model with such data, it would not be possible to create a sufficient representation of reality out there in the actual field. A factor that can complicate the solution at hand is what consequences the use of time series can have over the slightly longer term. Because if you choose to implement those, you implicitly also choose to trust the source (from now on and onwards in perpetuity), even when you know that the data will change.
Data Formats and Transformations
In addition to having to retrieve the information from various sources, data also come in various formats. The most common examples are probably WMS (Web Map Service), OGC API, and the service interface of Cesium Ion.
Taking care of the BIM models in a qualified manner appeared as one of the most complicated conversions. Since BIM’s IFC exchange format is not directly supported in the software, the source files first had to be converted to something that could be imported. The first transformation went from original (IFC) to glTF (GL Transmission Format), solved via the free tool Blender. Then we used the Cesium Ion cloud service to convert from glTF to Cesium 3D tiles.
Otherwise, transforming back and forth between different geomatic reference systems (see section on «Software for Managing Geospatial Information» further below) was a challenge. When we implemented the PoC, we had to do this ourselves. However, in the period since then the Norwegian Mapping Authority has launched an API service that relieves users of such chores.
We believe that one of the crucial things to cater to is the creation of a kind of ‘factory floor’ setup; a data pipeline where all operations that may be automated are set up as self-propelled assembly lines. Thus, obtaining up-to-date data becomes something that just happens in the background. These are tasks that every provider of a digital twin will need to have a conscious relationship towards, regardless of what kind of provider (public or private) this might be.
Software and Run-Time Environment
TerriaJS and CesiumJS
Much of the purpose of the pilot was to find out how suitable TerriaJS could possibly be as a ‘bottom pan’/chassis layer for a potential future national/joint digital twin. Why? Much because a significant part of Australia (like I said) has already been using this software for about two years, and eventually Japan also joined. And – this point is key – because the software is based upon open source. If you find a solution that works well, you do not need to set aside significant funds for ongoing license renewals, but rather make your investments in knowledge and self-managed further developments.
Here is an explanation that you do not need to read to benefit from the rest of the article. TerriaJS is based upon CesiumJS, another open source component that makes it possible to use map data from commercial Cesium Ion (one of the world’s most widespread platforms for map data; used by Unreal Engine to render true-to-life landscape environments, e.g. in several of the most reputable computer game titles on the market) without having to license the service. In this case, we set up a driving environment in the public cloud of Amazon; AWS.
Software for Managing Geospatial Information
Having to deal with the planet’s planetary conditions in a mathematically correct way is not trivial. This requires some insight into geographic information systems (GIS), as well as having software that solves the inherent tasks. Within the GIS subject area, there are also a few tools that are open and free, such as the reasonably well-known map application QGIS. However, in this blog post we won’t focus on tools that are prepared for end users, but rather tools that are invisible to the average user, but capable of allowing solutions such as digital twins to work – without making any geographical short circuits.
Specifically, we are talking about a couple of code libraries, PROJ and GDAL. While PROJ translates between coordinate systems, GDAL is a supporting component that translates between several different formats (including both raster/bitmap graphics and mathematically scalable vector graphics; the latter strictly speaking using OGR). Since there are a good number of conversion jobs constantly running, we created a set of afore-mentioned factory-like assembly lines or data pipelines that could repeat such operations, quickly and with unaltered quality. In order to have a good amount of flexibility and save some time, we set up the data pipeline using Python (which means that you use the Python version of the same libraries; PyPROJ and GDAL Python API). The challenge could have been solved in a number of different ways, but since we were lucky enough to have system developers who manage several programming languages, we used what is perceived as the best for each particular task. If the digital twin used in our PoC setup had been targeted for production, we would have gone over and improved several pieces of the rig, but it worked well for a PoC.
Other Platform Options
There are several players that offer software solutions for digital twins. Some of these are based on free software (like the aforementioned GeoAdmin MapViewer from the Swiss government), but most are still commercial (such as those from Autodesk, Bentley, Cityzenith, Dassault and Esri… as well as other players with names beginning with other letters from the alphabet :-D)
Open/Free or Commercial?
This is well worth serious considerations. Commercial software means that you have access to something that works in a pre-packaged format, along with training and support. You can even approach the vendor to take care of development of particular extensions, etc. But it also means that you ‘marry’ a supplier that makes a living from license money, and the fee is often set at approx. 20% annually of the original acquisition amount. This means that you end up buying the same platform over again, equivalent to every fifth year. If one also assumes that a large digital twin should be an arena that many parties use (and enter their own respective assets / responsibilities), the result could quickly mount to many paying a lot – throughout the lifetime of the system. If we also add that one would often have a decade(s) perspective, the ongoing costs aspect becomes rather serious. Besides there is the paradox that a license is a paid right to continue to use your own data – on top of a platform that is actually rented.
Here we make an assumption (which may be wrong?): The Norwegian market for so-called full-fledged digital twins based on commercial software is probably limited. Especially since there are already several players who want to offer a fully operational service. In Norway alone, we have at least three players who offer digital twin as a cloud-based service platform. These are Aize (part of Aker, primarily covers the energy industry), aforementioned AugmentCity (covers primarily municipalities, with the cities of Ålesund and Bodø as two good examples) and Kongsberg (also primarily for the energy industry). But for those who want a better understanding, DNV has prepared a buyer’s guide.
Summary of findings
In addition to the a-ha experiences that you may have had by reading this article, there are several conclusions that can be drawn:
- Getting started with geographic information systems is not necessarily «completely straight forward». Investments in testing and learning are valuable anyway, and for those who want to master it it’s absolutely necessary.
- Mixing 2D (maps) with heights / depths to a landscape with hilly terrain, 3D objects (buildings and other physical installations) and variation / movement 4D (time series; to reflect change over time) requires a well-thought-out approach. From the beginning, you should be prepared that everything (especially heights) will not match without adjustments
- Also be prepared for the fact that BIM models of real objects are almost always linked to an owner. Guidelines must be adhered to.
- Set up as a service that can be accessed from anywhere, by anyone. Few things are more frustrating than success - only to discover that new potential users are not gaining access just because a computer is not on the network
- A short introductory video gives a taste of how two geographically inexperienced but otherwise skilled guys (Kristian Stamland and Håkon Carlsen) overcame the assigned construction job in four months.
By clicking on the picture, you will get a short (2 min.) introduction where Håkon and Kristian explain how they proceeded.
The way forward
The themes discussed above are necessarily different for the national public sector than what can be achieved for narrower targeted businesses. If all or part of a country’s administration embark on a joint project to take care of a common platform, then maybe you and I – and our respective employers – may start to put in our physical assets (assets; buildings, etc.) – and then start simulating or realizing business collaboration with others. As far as I know, there are no concrete plans for this as of now. Otherwise, if there is no common public platform, we will either have to be patient or build something ourselves. Knowit has already set up one instance of this digital twin, it can be made available as a playground. Besides, we are open for suggestions and/or collaborations. And if you as a private person cannot wait to try it out, you may want to pursue options like going through the [Norwegian only] Data Village, creating some KML files (Keyhole Markup Language, typically via SketchUp) and placing them into Google Earth, or maybe something completely else?
– Please tell us what ideas you think should be pursued!
Metaverses?
Increasingly more of our technological attention is pulled towards understanding how virtual worlds or so-called metaverse/quasi-realistic worlds (like Decentraland, Fortnite Concerts, Horizon Worlds, Sandbox and maybe even Minecraft?) will af